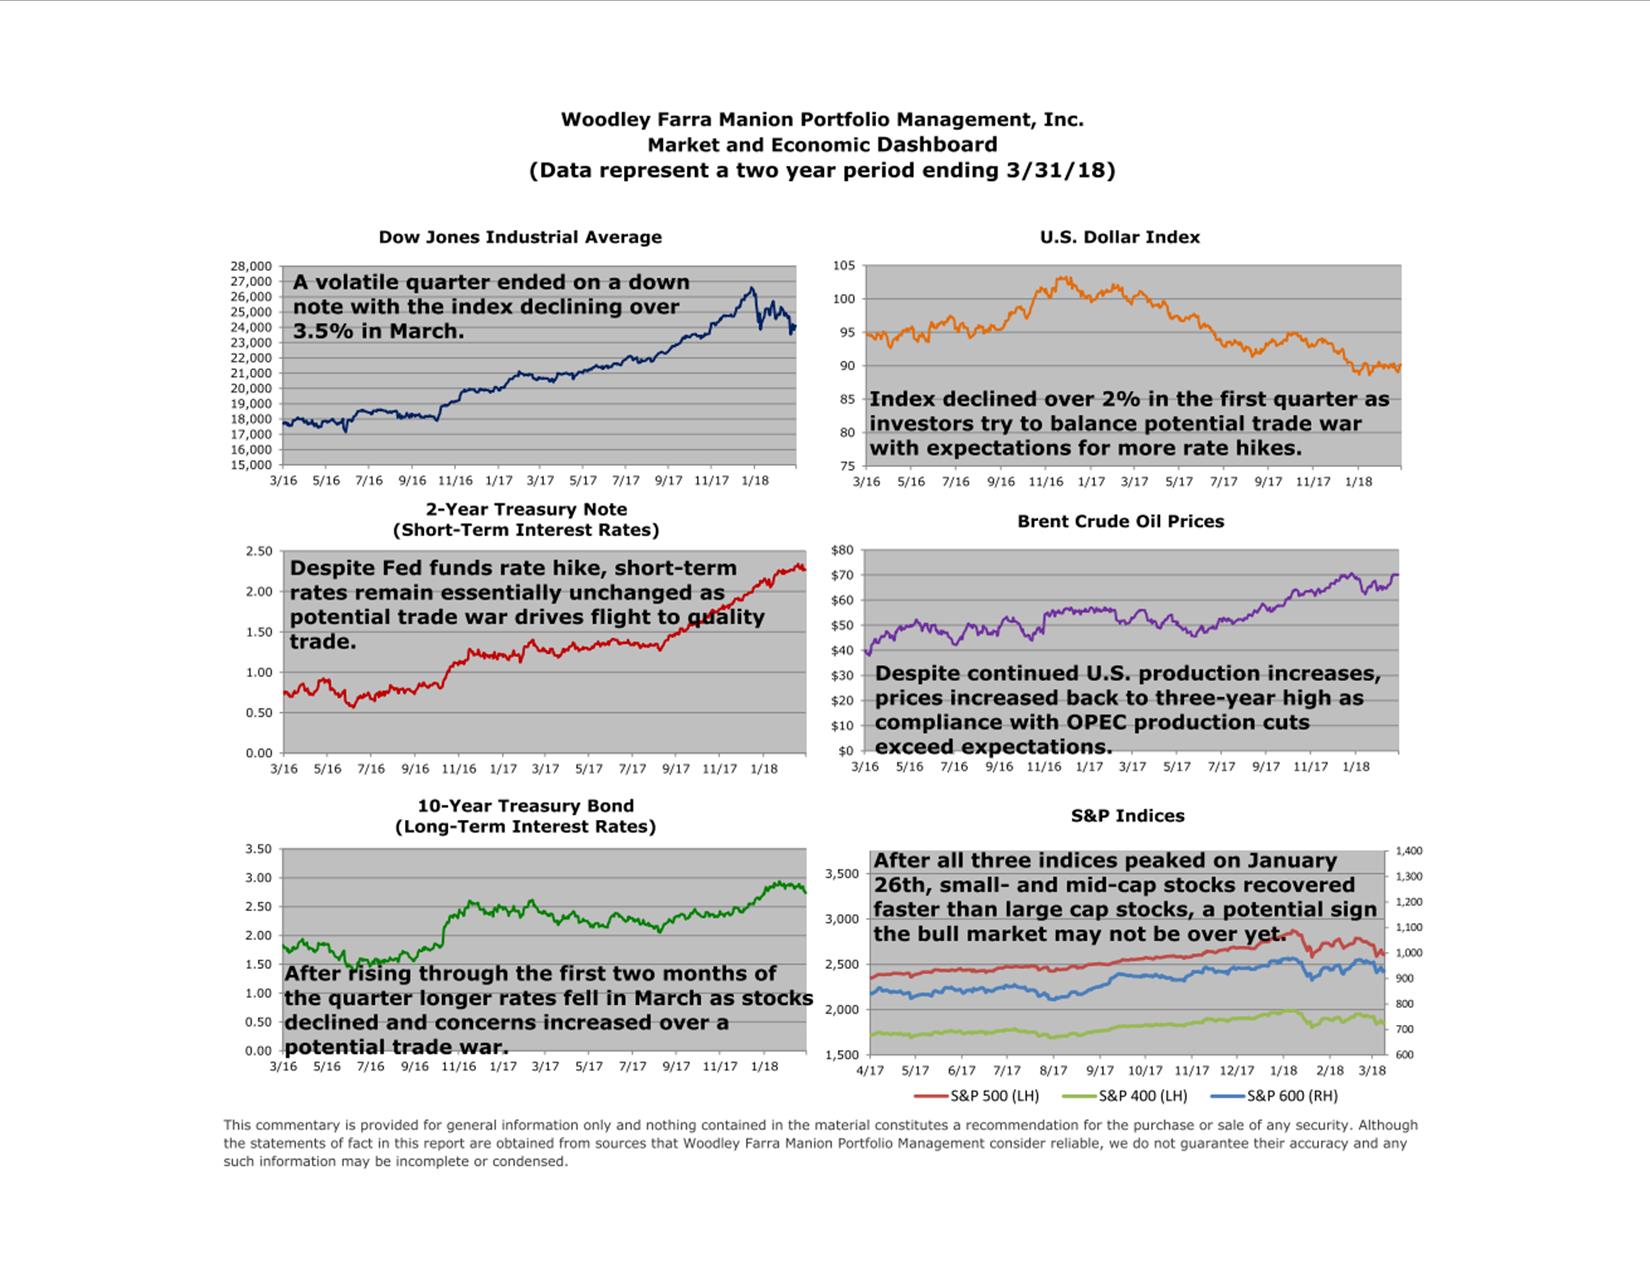
The first quarter of 2018 started off with a bang as stock market indexes climbed over 6% by January 26, one of the better starts to a new year. After a placid 2017, meaning little or no volatility, investors were spooked by the January labor report that suggested wage inflation was accelerating and the Federal Reserve would have to raise interest rates more than anticipated. This fear of higher interest rates triggered a month-long bout of selling, driving down the S&P 500 over 11% before recovering a good portion of this loss by mid-March. The rebound was short-lived, however, due to the fear of trade wars, which caused the S&P 500 to fall back to the closing low it made on February 8.
With the market recently celebrating the ninth anniversary of the new bull market, investors have rightly questioned if the big gains in January may represent the bull’s last gasp. Market tops generally take time to develop as smaller stocks peak first, followed by mid-sized companies and finally large stocks begin to fall. This process can take up to one year.
The chart below tracks the S&P 500 (large companies), S&P 400 (mid-sized) and S&P 600 (small). Please note all three indexes reached a peak on or about January 26, so there is no evidence of the typical topping pattern of the smaller stocks lagging behind the large ones.

Additionally, the two smaller indexes have rebounded faster than the S&P 500, thereby confirming neither has begun to underperform the large index.
So, it looks like the February through March pullback represents a long overdue correction; the last 10% correction in the market was at the beginning of 2016. Also, the 2018 correction may have been exacerbated by the unwinding of little-known investment strategies that were assuming the low volatility of 2017 would last indefinitely. As we occasionally note in our office, “you can’t say trend without saying end.” All trends come to an end, and lower volatility is now a thing of the recent past.
Happy Spring!
George Farra, CFA
