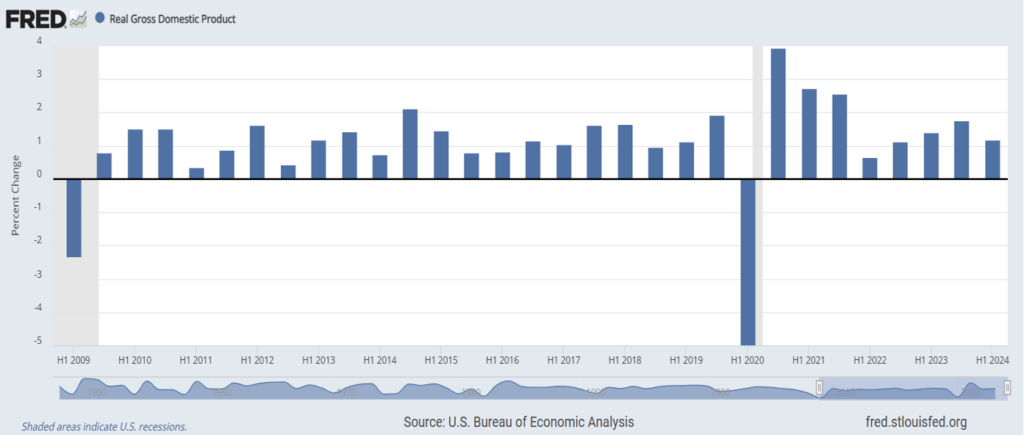
The US economy has weathered a lot of disruptions and changes since the COVID-19 pandemic began in the first quarter of 2020. The shutdown of the economy triggered a brief bear market in stocks and a recession that lasted two quarters before the impact of federal government support began to kick in.

The start date of the chart above is 2009, when the economy finally emerged from the Great Recession that began in late 2007. The technical definition of a recession is two consecutive quarters of declining gross domestic product. The bars in the graph are six-month periods to capture the two consecutive quarters that might signal a recession.
Note: The US experienced only one recession over the entire fifteen-year period of this analysis, in the first half of 2020. Stated differently, the US has been in recession for only two of the past 60 quarters (3.3%). Growth has been strong, and personal incomes have risen accordingly.
The Fed began to raise interest rates in 2022, to fight inflation caused by federal stimulus payments and the full reopening of the economy. Calls for a recession were frequent and loud, and yet the economy continued to grow while inflation subsided. Given the Fed is now reducing short-term interest rates, the likelihood of recession is probably declining.
The US economy is the envy of the world. Europe, Japan, and Canada have lagged since 2008 to the point that the European Union per capita GDP is now barely 50% of US per capita GDP. That ratio was 76% in 2008.
—George S. Farra, CFA (10/31/2024)
